 Over the past couple of days, since receiving my draft report back, i’ve been re-looking at what I am trying to achieve. I got some good feedback back from my supervisor and realised what i’d written was too in-depth and what should be going into an essay rather than that of a report. I realised I hadn’t been looking at my key aims as I wrote and underpinning my theory with my practice or these aims so no wonder I couldn’t get it right!
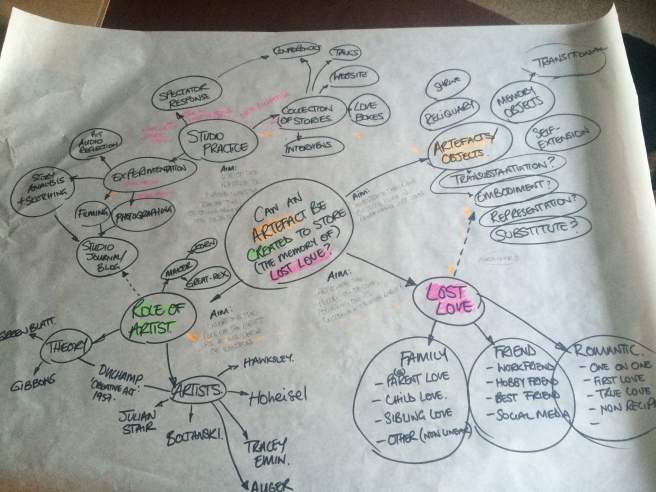
I went back to ‘Visualizing Research‘ by Carole Gray and Julian Malins which has been really helpful in terms of working out how to correlate the practical making side with the theory side. Just doing the map above of my research question along with each of the aims and where they are covered within the practical or theory side has really helped. It also shows the links between each of the areas which I suppose was just what I needed to do to see how it fitted. I still have to add all the people/books etc I’ve looked at to the diagram, but this can then be used for the overall mapping of the project.

I am now trying to re-focus on my literature and so have done a breakdown of ‘love’s terms of how this fits in with my making and my data collection that I have already done. This has shown that child for parent and grandparent is the most submitted, followed by romantic love. Love for a lost child has not been submitted at all. This might be because it is too emotional to talk about. Other areas lacking were that of friendship. This may be due to it not being considered ‘love’ as such. I’ve then got to compare to my making.
Better get on with it!
